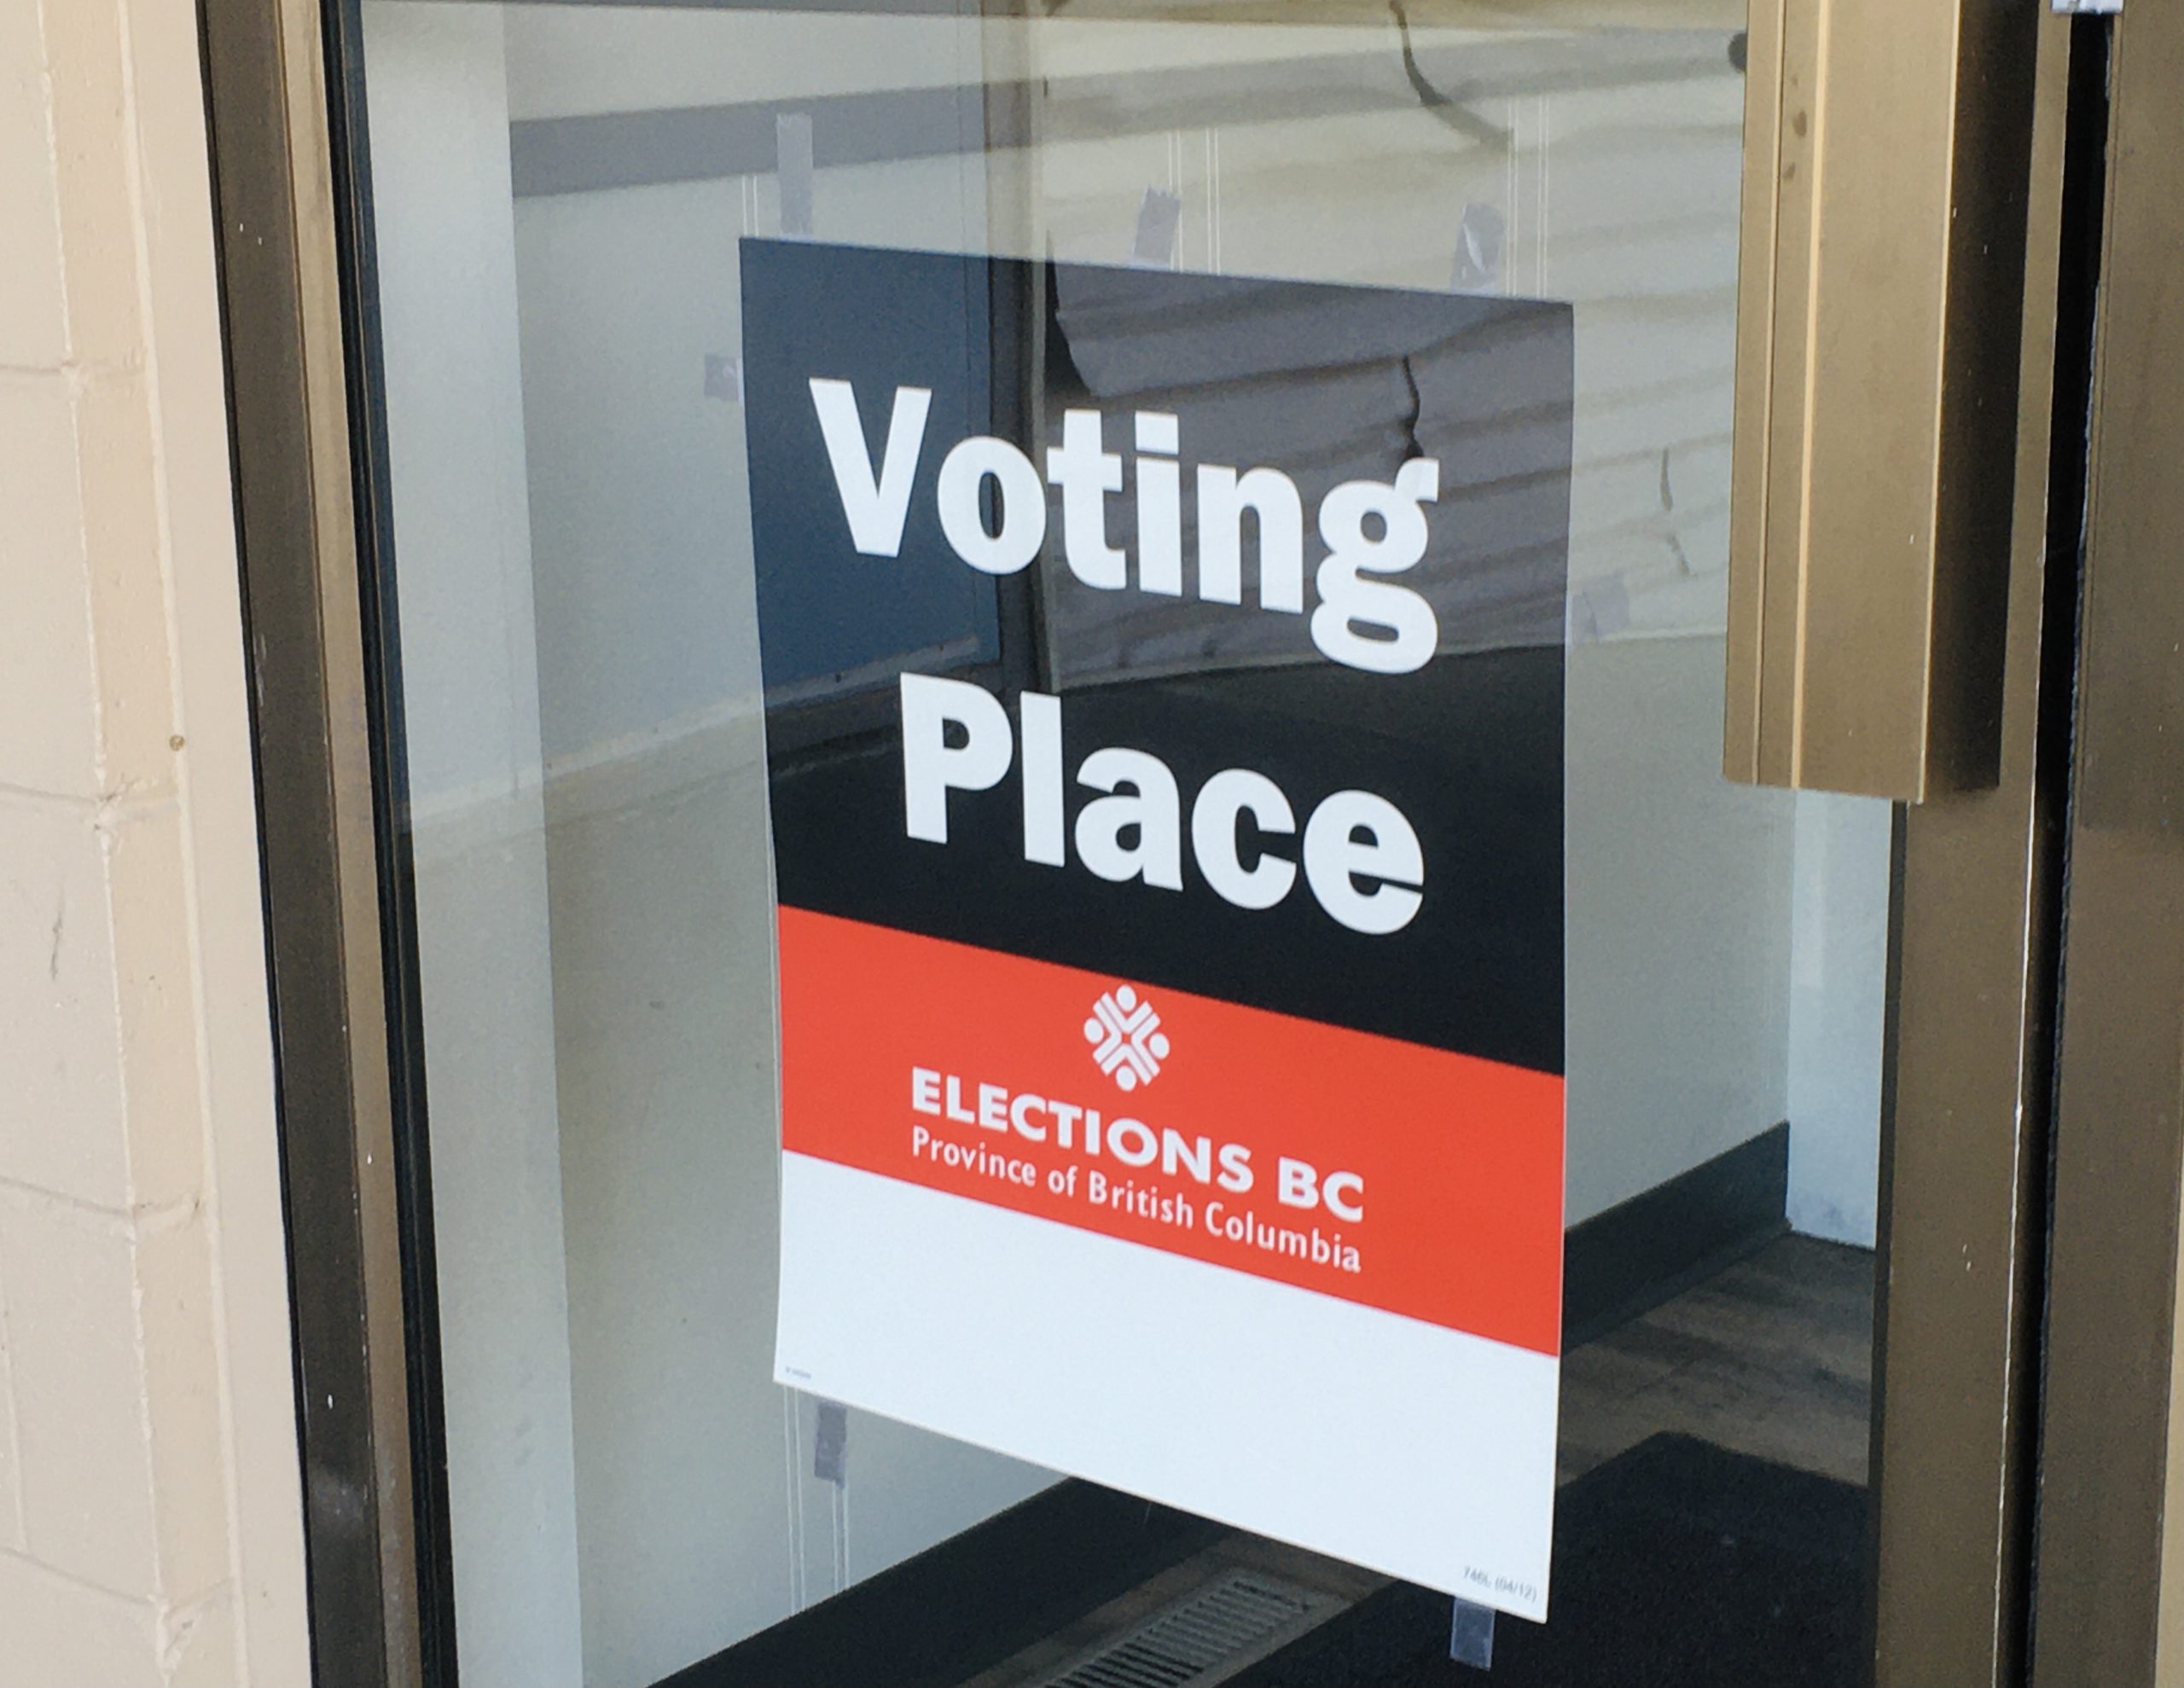
Fewer East Kootenay residents cast their ballots in the 2022 local election than the previous one.
Across the region, the 2022 local election saw an average turnout of 38.3 per cent, compared to 48.2 per cent in 2018.
In terms of percentage, Fernie had the highest turnout, with 54.6 per cent, as 2,485 of the 4,552 eligible voters cast their ballots.
This compared to 2018 when 64.2 per cent of the 2,520 eligible residents voted in the local election.
Meanwhile, Cranbrook had the lowest voter turnout this election with 27.7 per cent. Only 4,479 of the 16,169 possible voters showed up at the polls.
That said, this was still up from the 2018 when 4,012 people voted out of the 15,067 eligible residents. This made for a turnout of 26.6 per cent.
This is a 1.1 per cent increase in votes, despite this election having two mayoral candidates, while Lee Pratt won the 2018 election by acclamation.
Elkford was the only other East Kootenay community to see a small increase in voter turnout.
In this election, 701 of the 1,993 eligible voters cast their ballot for a turnout of 35.2 per cent. In 2018, 34.6 per cent of the 1,965 eligible residents voted, with 679 ballots cast.
This amounts to a 0.6 per cent increase between 2018 and 2022.
You can find the breakdown of each East Kootenay community below.
Local election voter turnout
- Canal Flats
- 2022
- 343 did not vote – 318 voted (661 total)
- Est. turnout – 48.1%
- 2018
- 151 did not vote – 387 voted (538 total)
- Est. turnout – 71.9%
- 2022
- Cranbrook
- 2022
- 11,690 did not vote – 4,479 voted (16,169 total)
- Est. turnout – 27.7%
- 2018
- 11,055 did not vote – 4,012 voted (15,067 total)
- Est. turnout – 26.6%
- 2022
- Elkford
- 2022
- 1,292 did not vote – 701 voted (1,993 total)
- Est. turnout – 35.2%
- 2018
- 1,286 did not vote – 679 voted (1,965 total)
- Est. turnout – 34.6%
- 2022
- Fernie
- 2022
- 2,067 did not vote – 2,485 voted (4,552 total)
- Est. turnout – 54.6%
- 2018
- 1,405 did not vote – 2,520 voted (3,925 total)
- Est. turnout – 64.2%
- 2022
- Radium Hot Springs
- 2022
- 702 did not vote – 417 voted (1,119 total)
- Est. turnout – 37.2%
- 2011 (all candidates won by acclamation in 2014 and 2018)
- 436 did not vote – 164 voted (600 total)
- Est. turnout – 27.3%
- 2022
- Kimberley
- 2022
- 4,403 did not vote – 1,857 voted (6,260 total)
- Est. turnout – 29.7%
- 2018
- 2,864 did not vote – 2,860 voted (5,724 total)
- Est. turnout – 50%
- 2022
- Sparwood
- 2022
- 1,943 did not vote – 1,072 voted (3,015 total)
- Est. turnout – 35.6%
- 2018
- 1,613 did not vote – 1,150 voted (2,763 total)
- Est. turnout – 41.6%
- 2022
- All communities:
- Avg. turnout 2022 – 38.3%
- Avg. turnout 2018 (Radium is not included, all candidates ran unopposed) – 48.2%


